The findings in 30 seconds
- How much a brand is talked about (social following, review volume, traffic, Wikipedia, listicle presence) strongly predicts how often AI recommends it.
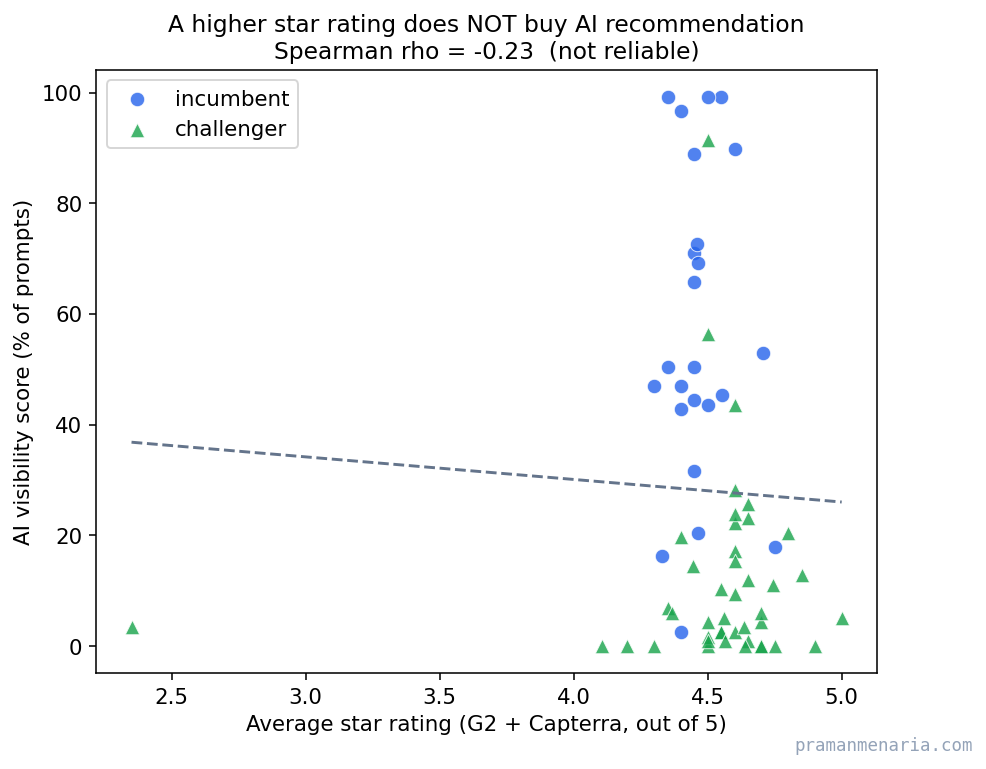
- How well a brand is rated does not. The average star rating across G2 and Capterra has no positive link to being recommended.
- Listicle presence is the single most durable signal. It predicts recommendation even after controlling for size, and holds for both incumbents and challengers.
- SEO gets you in the door; trust gets you recommended. Classic SEO signals explain 35% of who AI recommends; third-party trust signals explain 58%, and add real lift on top.
- The three AI models agree on what matters but disagree sharply on specific mid-tier brands. AI visibility is really three audiences.
Everyone wants to be the answer. Almost no one has measured what actually earns it.
When you ask ChatGPT, Claude or Gemini for "the best helpdesk software" (or sales engagement, or product analytics), a handful of brands get named. The obvious question for anyone doing organic growth is: why those brands? This study is an attempt to answer it with data instead of opinion.
I picked three structurally different B2B SaaS categories, put together a roster of 68 vendors, and asked each of the three leading AI models the same category questions, with web search switched on, three times each, to smooth out randomness. That is 351 responses. Then I measured, for every brand, how consistently each model recommended it, and correlated those recommendation rates against 14 "Layer 2" trust signals: domain authority, traffic, backlinks, review counts and ratings, social followers, Reddit chatter, Wikipedia, and the brand's presence in third-party "best-of" listicles.
Part 1: what predicts AI recommendation (all 68 brands)
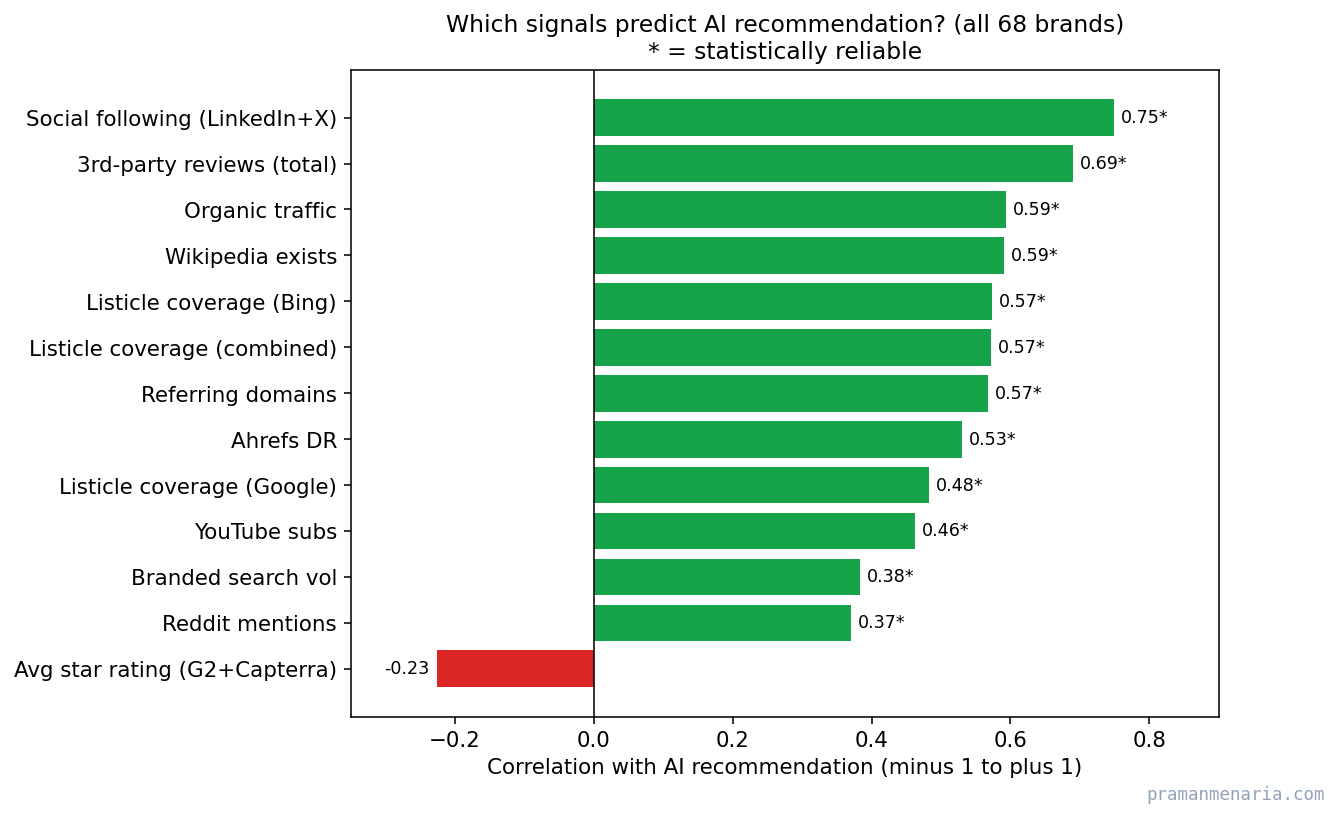
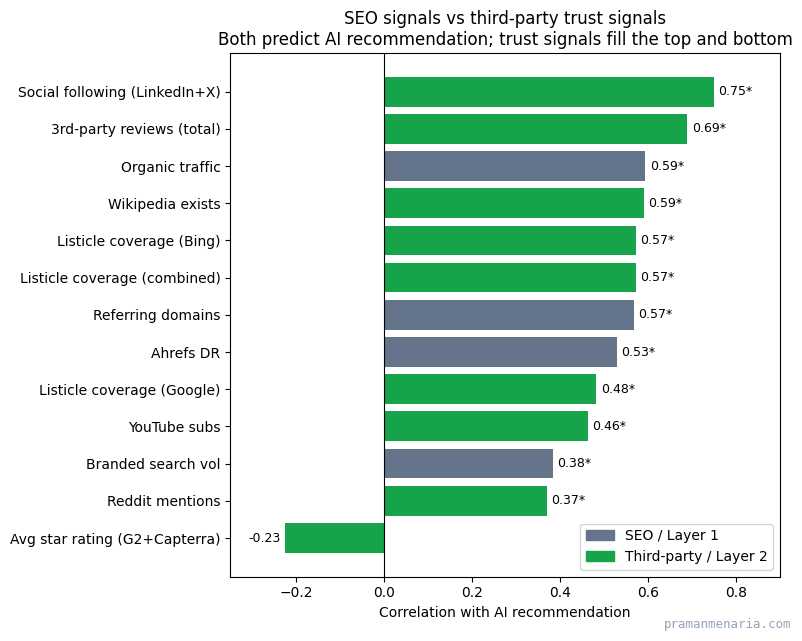
Every green bar above is a signal that reliably tracks AI recommendation. The strongest are social following (0.75) (LinkedIn and X followers combined), total third-party review count (0.69), organic traffic (0.59), simply having a Wikipedia page (0.59), and listicle coverage (0.57). The through-line is footprint: the more a brand is discussed, linked, and listed across the web, the more AI vouches for it.
AI rewards how much you are talked about, not how well you are rated.
The most useful surprise is what doesn't work. A brand's average star rating across G2 and Capterra (the 1 to 5 score) has a slightly negative relationship with being recommended, and it isn't reliable. Plenty of well-loved niche tools carry beautiful ratings and almost no AI visibility. The number of reviews matters; the average score of those reviews does not.
Why this holds up: two robustness checks
Big brands score high on every signal at once, so a naive correlation risks just re-discovering "big brands win." I ran two checks to guard against that.
Check 1, competing all signals together. Put every signal into one model and most of them overlap and cancel out, except listicle coverage, which keeps independent predictive power (p = 0.001). In plain terms: listicle presence explains recommendation even after accounting for DR, traffic, reviews and followers. It adds something the raw SEO numbers don't.
Check 2, incumbents versus challengers. Splitting the roster into established incumbents and smaller challengers changes the story in a revealing way: Ahrefs DR stops mattering inside either group (chasing DR alone won't move you), follower and review counts matter mainly for challengers breaking in, and listicle coverage is the only signal that stays significant for both tiers. It isn't just an incumbency proxy.
SEO signals vs third-party trust signals: which layer wins?
Group the signals into the two layers of the framework. Layer 1 is classic SEO (domain authority, traffic, backlinks, branded search). Layer 2 is off-site trust (reviews, ratings, Wikipedia, listicles, social, Reddit). Then ask a sharper question than any single correlation can: how much of AI recommendation does each layer actually explain?
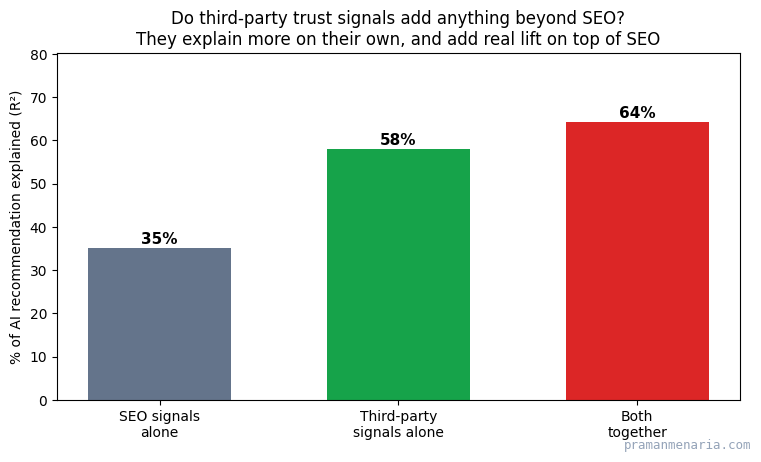
SEO signals on their own explain about 35% of who AI recommends, which is real: Layer 1 is the price of entry. But third-party trust signals explain 58% on their own, and adding them on top of SEO lifts the total to 64%, a jump of 29 points. Going the other way, adding SEO on top of trust adds only 6 points. In plain terms, the trust signals already contain almost everything the SEO signals tell the model, and a great deal more.
The thesis in one number: SEO explains 35% of AI recommendation; trust signals explain 58%.
Part 2: how the three categories differ
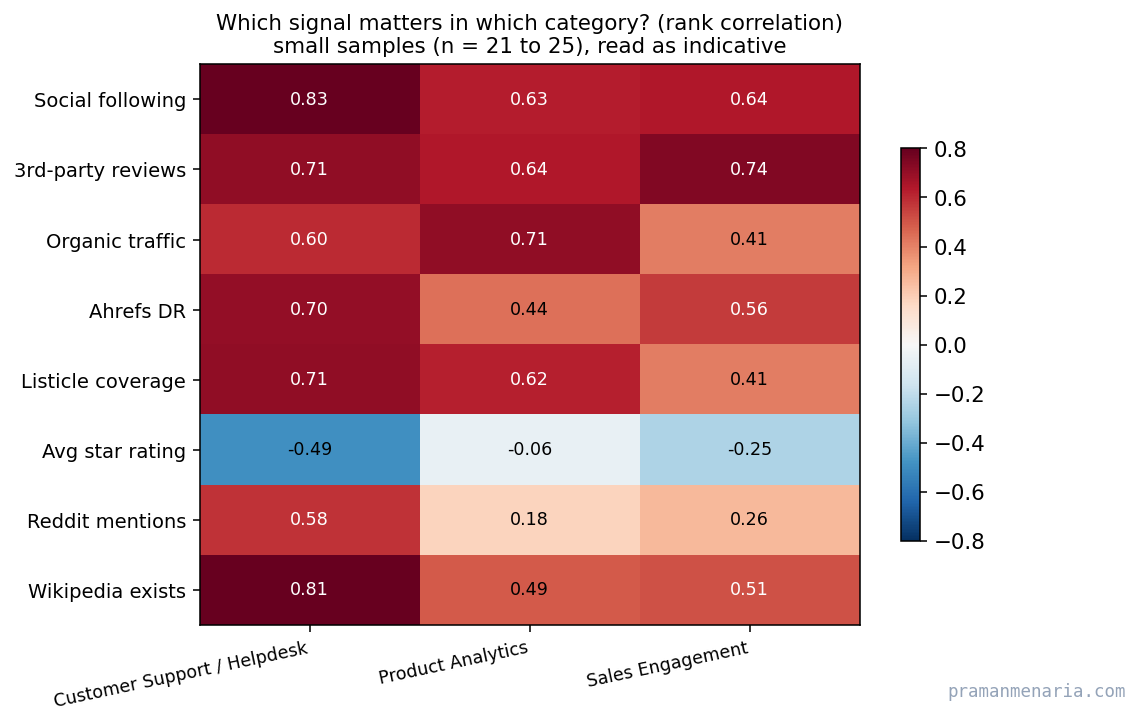
The headline pattern holds everywhere, but each category has its own texture. Here is who AI recommends in each, and which signals move the needle.
Customer support / helpdesk
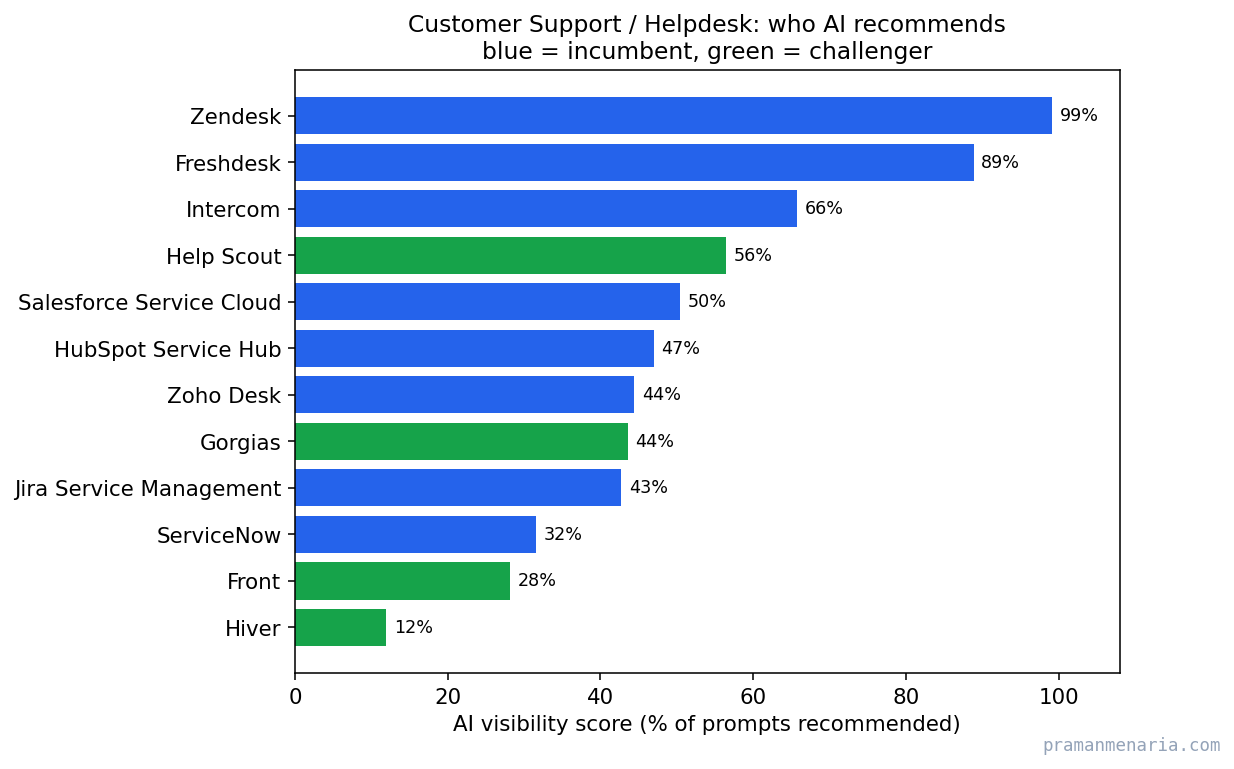
Helpdesk is the clearest "presence wins" case. Having a Wikipedia page (0.81), listicle coverage (0.71) and review volume (0.71) are all strong. And the ratings penalty is at its most extreme here (average-rating correlation of −0.49): well-rated niche tools are actively less visible than famous ones. Reddit chatter also carries more weight here than elsewhere.
Sales engagement
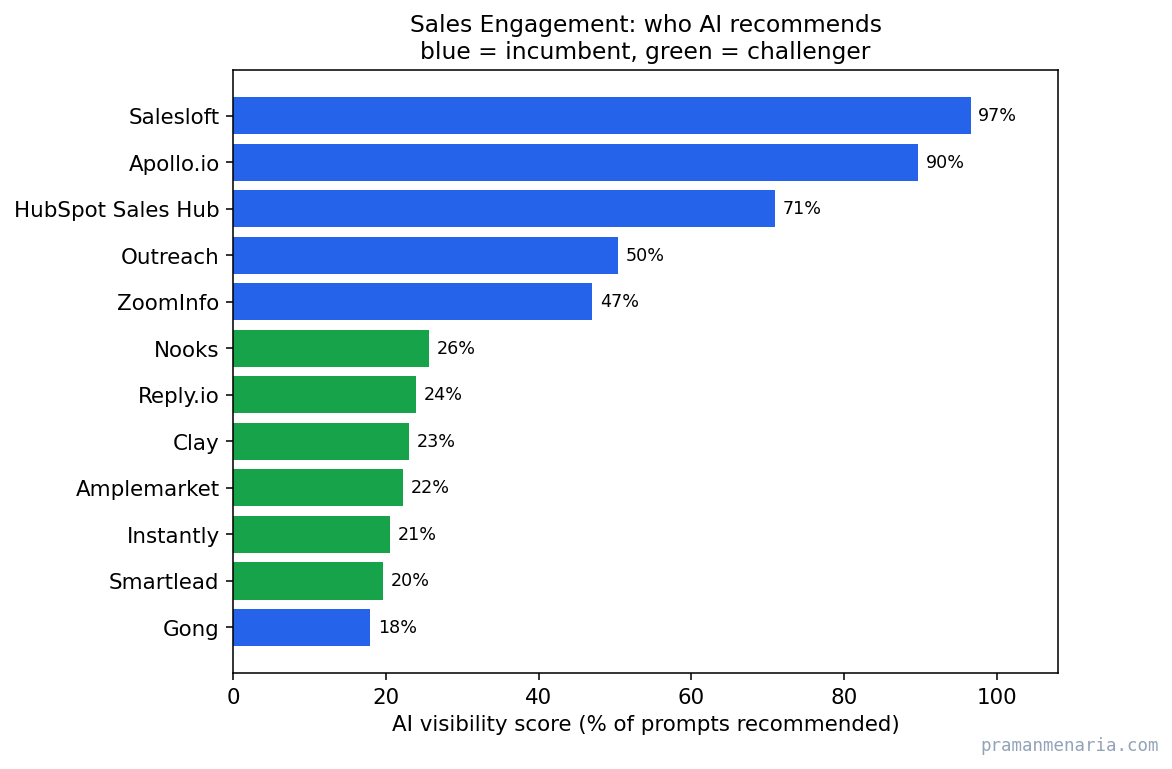
Sales leans more on raw brand size: review volume (0.74) and social following (0.64) lead, while listicle coverage matters less (0.41) in this noisier space, and ratings stay unhelpful. Notably, models recommend the whole go-to-market stack: a data platform like ZoomInfo surfaces alongside pure sales-engagement tools.
Product analytics
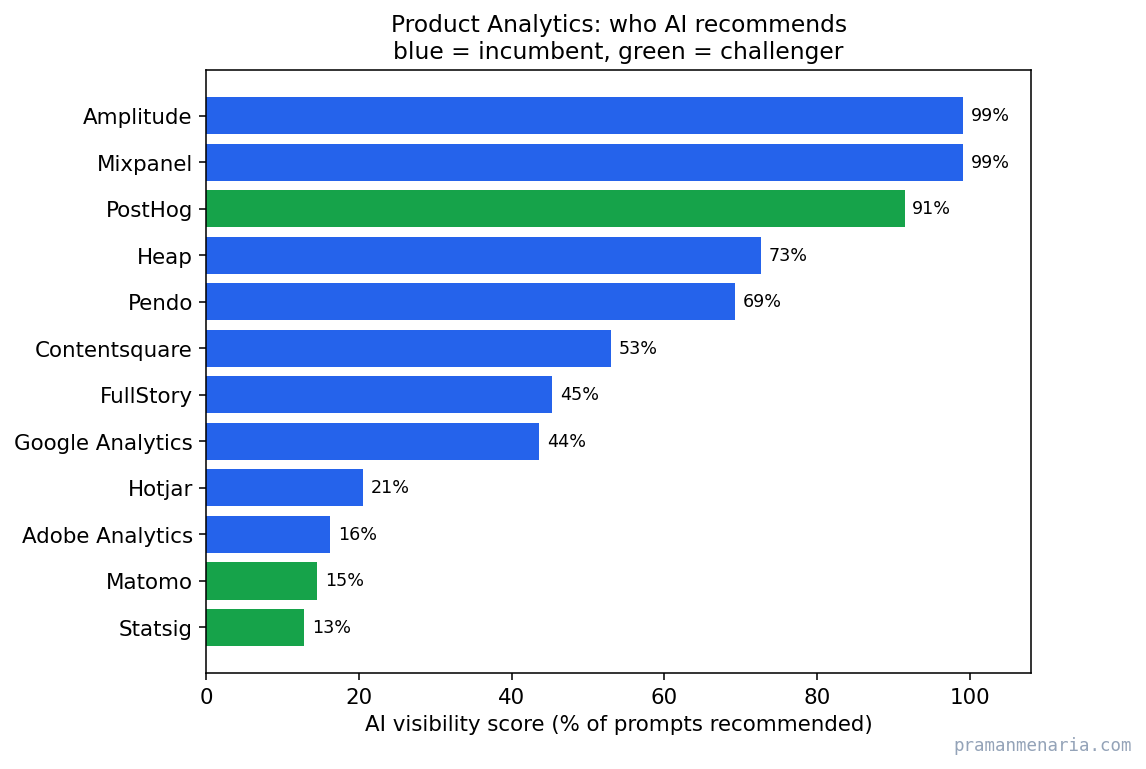
Analytics rewards reach and traffic most (organic traffic 0.71, social following 0.63), with listicle coverage still solid (0.62) and ratings irrelevant. PostHog is the proof case that a challenger can out-visibility incumbents. It helps that PostHog is fully open-source (MIT-licensed, free to self-host with a generous free cloud tier), which fuels exactly the kind of developer chatter, GitHub presence and third-party coverage that this study shows AI rewards.
Part 3: do the AI models behave differently?
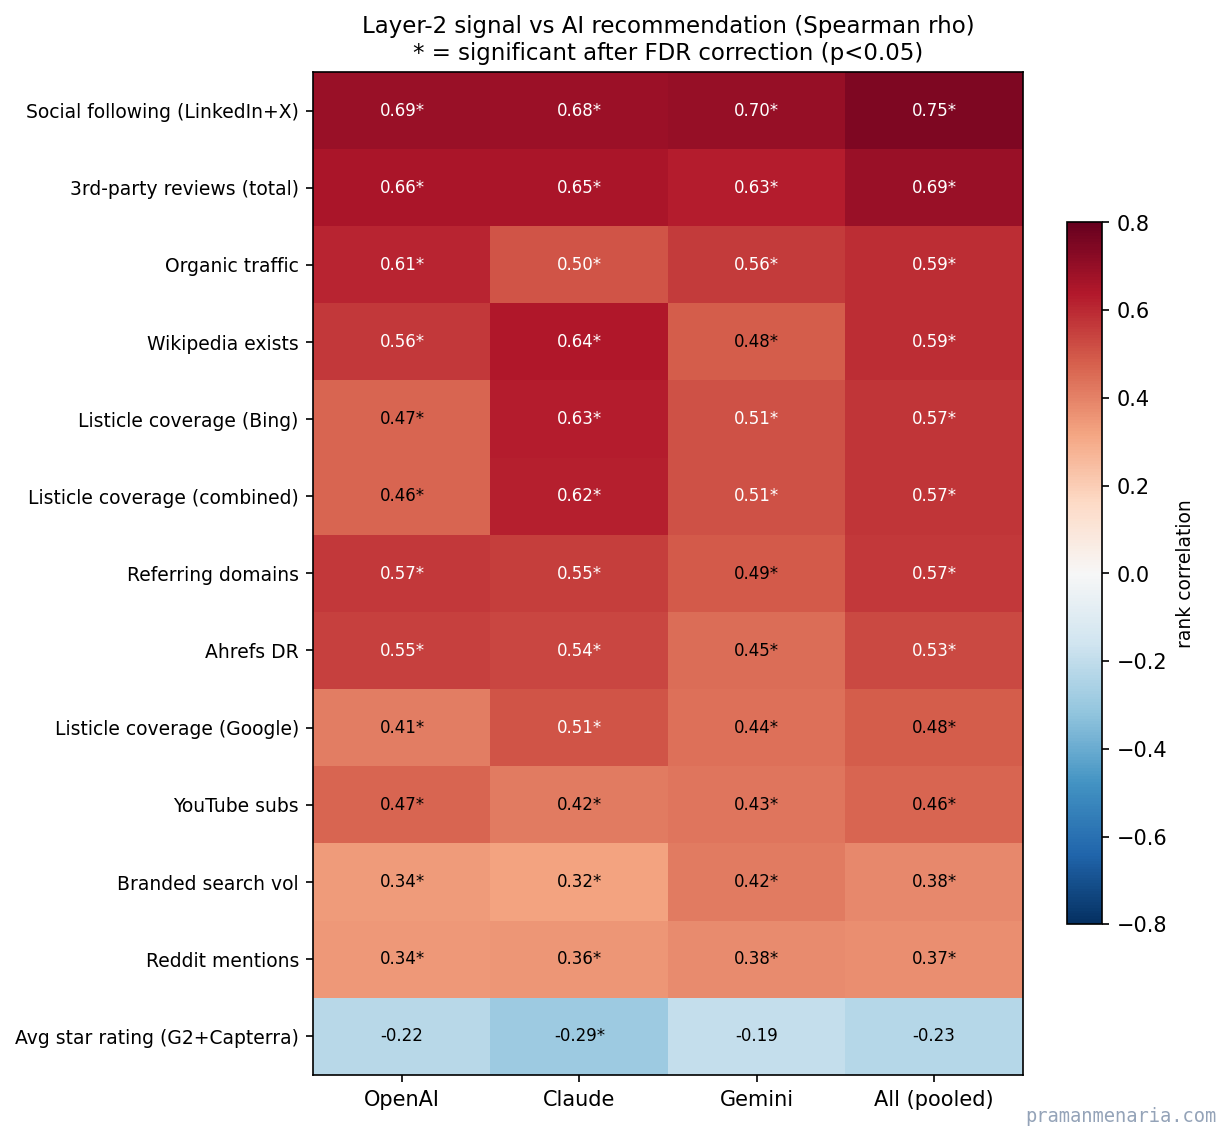
Less than you would think on what predicts recommendation. Social following is the number-one signal for all three models. But they clearly disagree about specific mid-tier brands.
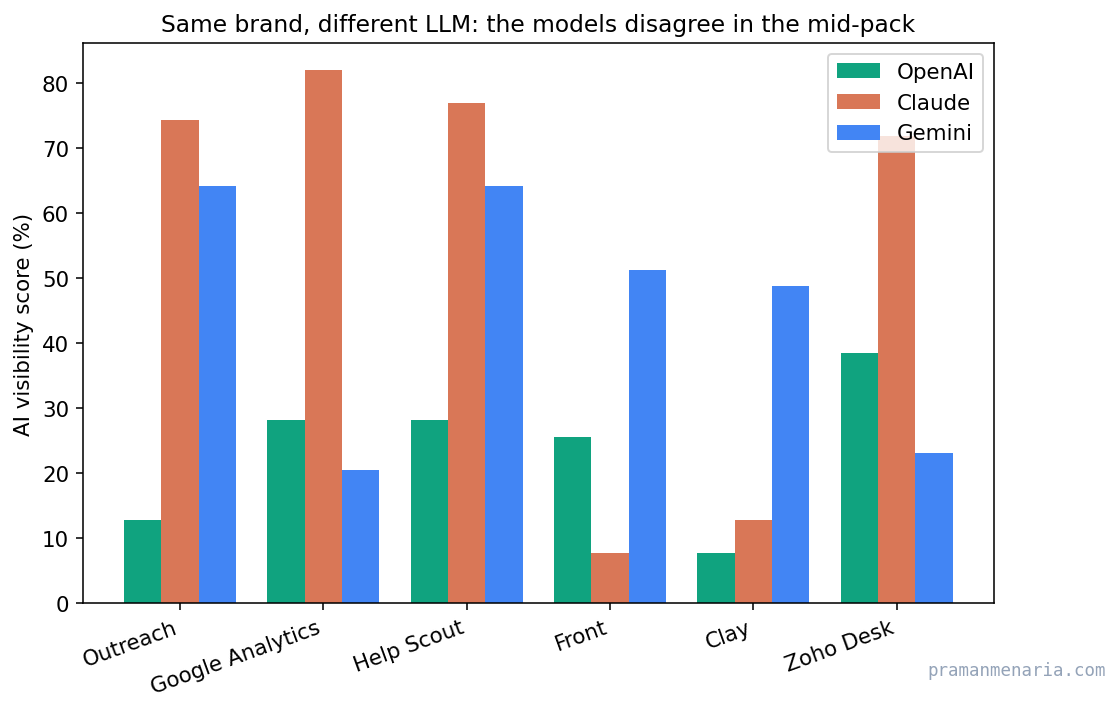
Claude leans a little more on Wikipedia and listicles, favouring brands with strong third-party editorial footprints. Gemini leans slightly more on raw organic traffic. OpenAI sits between them. So a brand can be a star in one model and near-invisible in another. Even though the models cite different sources, the brand attributes that earn a recommendation are broadly shared: the sourcing differs; the "who deserves it" logic is similar.
How the models source their answers
One more difference shapes strategy: the three models don't cite the same number of sources. Across all 351 responses, ChatGPT cited a median of just 7 sources per answer, while Claude cited 14 and Gemini 16, roughly twice as many. Every Claude answer we collected leaned on 10 or more sources; barely one in six ChatGPT answers did.
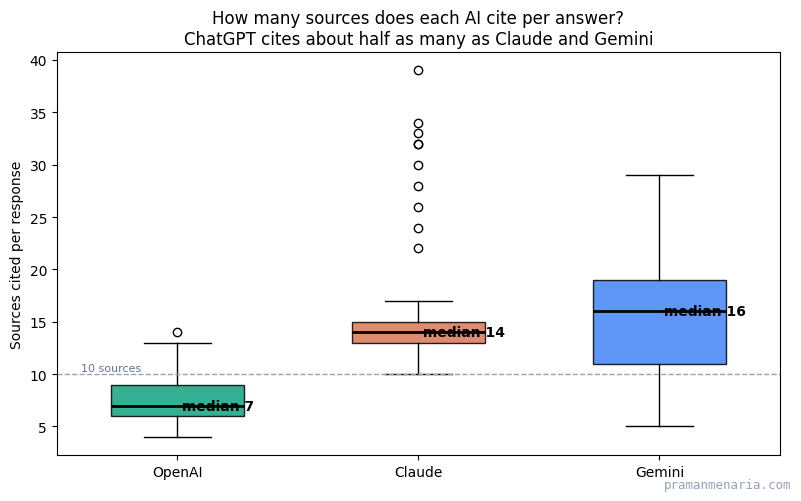
Claude and Gemini cast a wider net, so more brands get a chance to appear, while ChatGPT is more selective. But the bigger story is not how many sources each model cites, it is what kind. Classifying every cited URL by content type reveals three distinct sourcing philosophies.
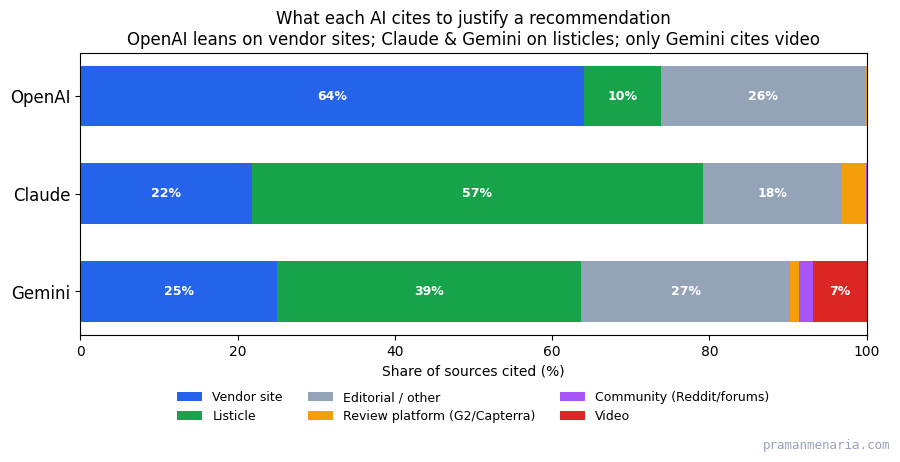
- OpenAI overwhelmingly cites the brand's own website (64%) and rarely uses listicles (10%). Win Layer 1 and control your own pages, and you feed ChatGPT directly.
- Claude leans heavily on third-party listicles (57%), citing vendor sites less than half as often (22%). To move Claude, you have to appear in other people's "best-of" roundups.
- Gemini is the most varied: listicles (39%), vendor sites (25%), plus, uniquely, YouTube video (7%) that the other two models never cite at all, and community threads, reflecting Google's own index.
The most telling number sits in plain sight: dedicated review platforms like G2 and Capterra make up 3% or less of citations in every model (and TrustRadius was never cited once) The places brands pour money into collecting star ratings are almost never what the AI actually reads when it makes a recommendation, which is exactly why rating scores don't predict visibility. What the models do read, listicles and editorial coverage and the brand's own site, maps cleanly onto the signals that topped Part 1.
One platform-specific quirk: video (YouTube) shows up only in Gemini's citations (about 7% of its sources), and never once in OpenAI's or Claude's. If your buyers are on YouTube, that channel buys you visibility in Gemini specifically, an artefact of Google owning both the model and the index.
One caveat: this counts sources as surfaced in each platform's response, which is what a user sees; it may not equal the model's full internal retrieval. Even so, the takeaway from Part 3 holds and sharpens: AI visibility is not one target but three, each reading a different corner of the web.
Does being cited actually drive the recommendation?
The two halves of this study come from different places: the trust signals were gathered by hand for each brand, while the citations came from the AI responses themselves. So it is fair to ask whether they actually connect. They do, at the level of individual answers.
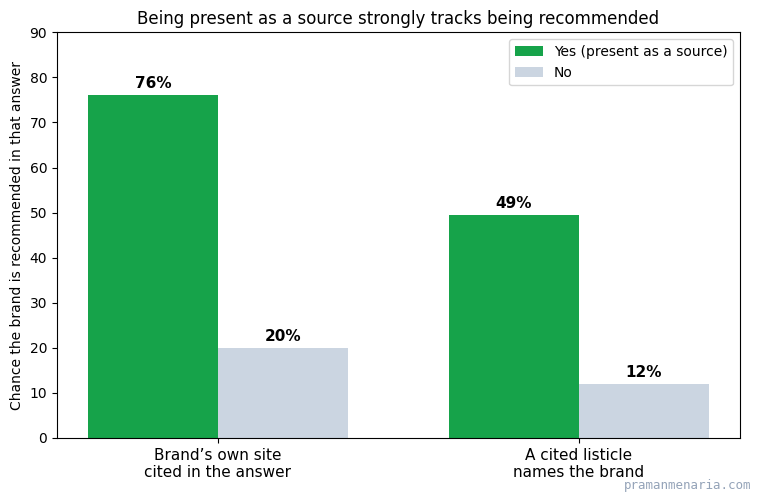
When an AI cites a brand's own website in an answer, that brand is recommended 76% of the time; when it doesn't, only 20%. And when a listicle the AI cited actually names the brand, the brand is recommended 49% of the time versus 12% when the cited listicles skip it. At the brand level these hold up too: how often a brand's own site is cited tracks its overall visibility (rank correlation 0.55), and how often it appears in the listicles the models cite tracks visibility even more strongly (0.78). In short, getting pulled into the answer as a source is tightly linked to getting named as a pick, which is why the hand-gathered trust signals and the model's citation behaviour tell the same story.
Two honest caveats. This is association, not proof of cause; a brand and its citations may both rise because it is simply prominent. And it isn't automatic: some brands (Reply.io, Mixmax) show up in the cited listicles often yet still aren't recommended much, so being in the room helps but doesn't guarantee the pick.
What this means: the Second Layer, measured
This study is the empirical backbone for a framework I have written about before, the Second Layer Problem. SEO fundamentals (DR, traffic) get a brand considered. But third-party trust signals, reviews, Wikipedia, and above all listicle presence, are what get it recommended. Listicle coverage is the one lever that works across every model and every brand tier, which makes it the most actionable place to start.
SEO gets you considered. Trust signals get you recommended.
Methodology
Collection. 68 vendors across three
categories (customer support/helpdesk, sales engagement, product analytics). Three AI models
were tested at these exact versions: OpenAI gpt-5.6-terra, Anthropic
claude-sonnet-5, and Google gemini-3.5-flash. Each was asked 13
conversational category prompts, each prompt run 3 times, with web search or grounding enabled. Total: 13 x 3 categories x 3
models x 3 repeats = 351 responses. A brand's visibility score is the share of the
39 responses per model-category in which it was recommended, computed within its own
category so brands are compared fairly.
Signals. 14 Layer-2 signals were collected per vendor (Ahrefs DR, organic traffic, referring domains, branded search, G2 and Capterra and TrustRadius review counts, an average star rating across G2 and Capterra, LinkedIn and X followers, YouTube, Reddit mention volume, Wikipedia presence, and listicle coverage on Google and Bing). LinkedIn and X followers are combined into a single "social following" index (the mean of each vendor's z-scored log-follower counts, so the larger platform doesn't dominate), because both are proxies for the same underlying brand reach; the individual counts remain in the open dataset. Listicle coverage was measured by scanning the top organic results for five "best [category]" query variations per category on each engine, keeping independent editorial roundups, and scoring how many named each vendor.
Analysis. Spearman rank correlation (robust to skewed web data), with Benjamini-Hochberg correction for running many tests, Fisher-z 95% confidence intervals, a within-tier confound check, and a multicollinearity-pruned regression. Skewed signals were log-transformed for the regression. To compare layers, signals were grouped into Layer 1 (SEO) and Layer 2 (third-party trust) and their explanatory power compared with incremental R-squared. Source counts are the number of distinct citation URLs surfaced in each response, and each citation was classified by content type (vendor site, listicle, review platform, editorial, community, video) from its domain, URL and page title. A page counts as a listicle only if it is a "best/top N tools" roundup that lists many tools; a named-brand comparison (A vs B vs C) is treated as editorial. To link citations to recommendation, own-site citations were matched by domain across all responses, and the 24 most-cited listicles (about 37% of listicle citations, appearing in 183 of 351 responses) were fetched and scanned for which study vendors they name.
Limitations
- Correlation, not causation. These signals track recommendation; the study does not prove they cause it. Both may rise from an unmeasured factor like genuine category leadership.
- Small samples in the splits. Per-category and per-tier results rest on 21 to 44 brands, so treat them as strong hints, not proof. Confidence intervals are reported for this reason.
- A snapshot in time. Live web and AI answers drift; data was collected August 2026.
- Version-specific. Results reflect the exact models tested (gpt-5.6-terra, claude-sonnet-5, gemini-3.5-flash). Other tiers, such as a Gemini Pro or a reasoning model, may weigh sources differently.
- The ratings finding is strongest in helpdesk and is stated precisely rather than over-generalised.
Open data
Download the full dataset
The complete dataset: every vendor's per-model visibility scores plus all collected signals (Ahrefs DR, traffic, backlinks, per-platform review counts and ratings, social following, Reddit, Wikipedia, and full listicle coverage). 68 vendors, 43 columns. Free to reuse with attribution (CC BY 4.0); a link back is appreciated.
Download CSV (68 vendors)Every column is defined in the data dictionary.